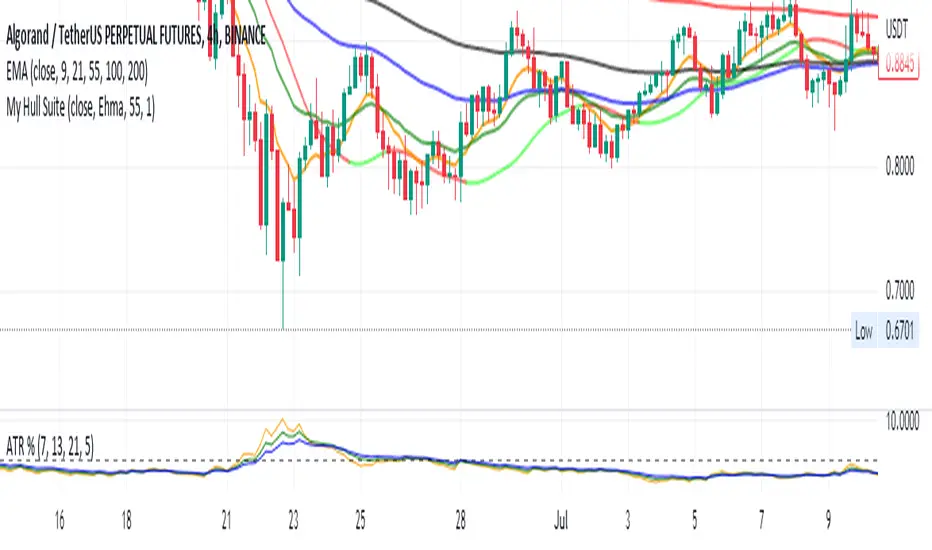
EMA curvesPlot EMAs for lengths 9, 21, 55 ,100, 200
An exponential moving average (EMA) is a type of moving average (MA) that places a greater weight and significance on the most recent data points. The exponential moving average is also referred to as the exponentially weighted moving average. An exponentially weighted moving average reacts more significantly to recent price changes than a simple moving average simple moving average (SMA), which applies an equal weight to all observations in the period.
Cerca negli script per "Exponential Moving Average"
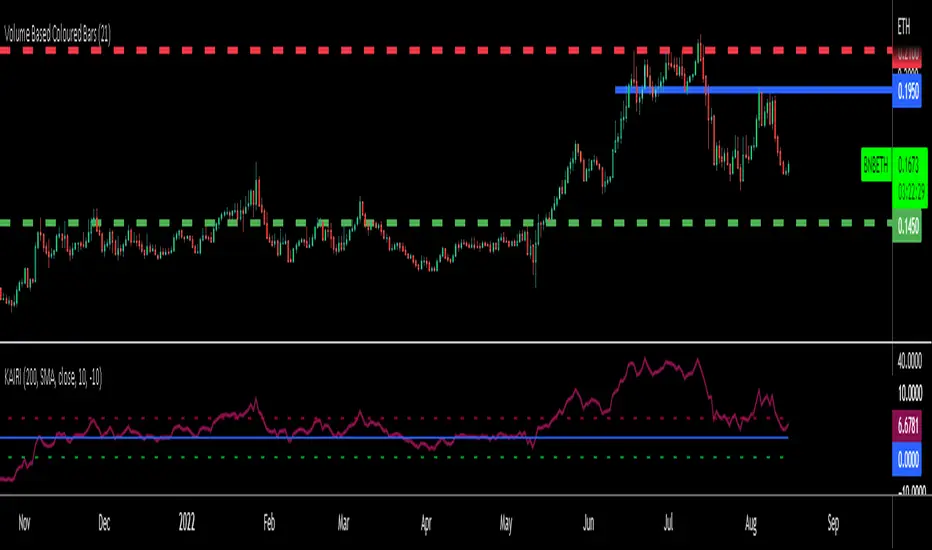
KAIRI RELATIVE INDEXAn old but gold Japanese indicator for Mean Reverting strategies and ideal for Pairs Trading...
The Kairi Relative Index measures the distance between closing prices and a Moving Average in percent value (generally SMA).
Extreme reading in the KRI are considered buy and sell signals.
Extreme readings will vary by asset, with more volatile assets reaching much higher and lower extremes that more sedate assets.
The KRI is not an accurate timing signal, and therefore, should be combined with other forms of analysis to generate trade signals.
You can calculate percent difference between the price and 10 different types of Moving Averages in this version of KAIRI as:
SMA : Simple Moving Average
EMA : Exponential Moving Average
WMA : Weighted Moving Average
TMA : Triangular Moving Average
VAR : Variable Index Dynamic Moving Average a.k.a. VIDYA
WWMA : Welles Wilder's Moving Average
ZLEMA : Zero Lag Exponential Moving Average
TSF : True Strength Force
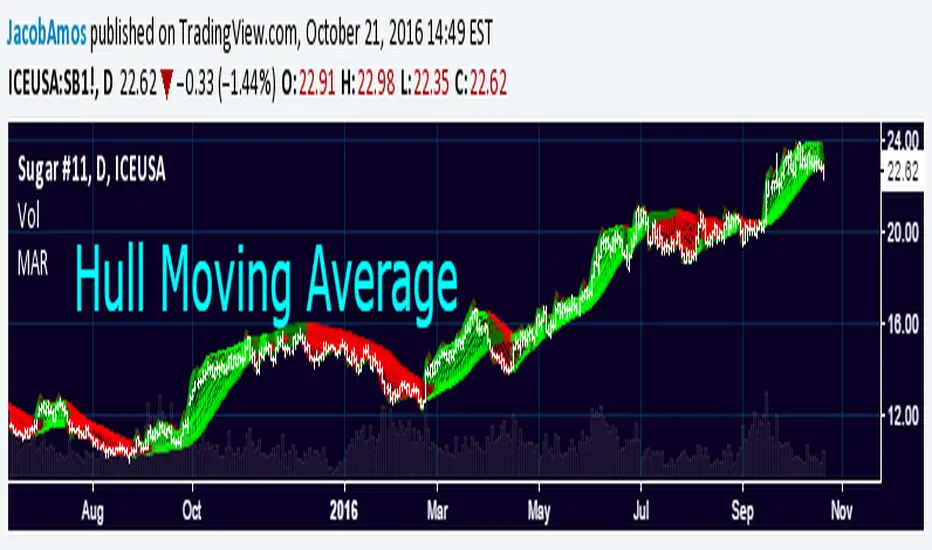
HULL : Hull Moving Average
VWMA: Volume Veighted Moving Average
Personal advice: try using bigger length of Moving Averages like 50-100-200 for pairs and mean reversion strategies
Any RibbonThis indicator displays a ribbon of two individually configured Fast and Slow and Moving Averages for a fixed time frame. It also displays the last close price of the configured time frame, colored green when above the band, red below and blue when interacting. A label shows the percentage distance of the current price from the band, (again red below, green above, blue interacting), when the price is within the band it will show the percentage distance from median of the band.
The Fast and Slow Moving Averages can be set to:
Simple Moving Average (SMA)
Exponential Moving Average (EMA)
Weighted Moving Average (WMA)
Volume-Weighted Moving Average (VWMA)
Hull Moving Average (HMA)
Exponentially Weighted Moving Average (RMA) (SMMA)
Linear regression curve Moving Average (LSMA)
Double EMA (DEMA)
Double SMA (DSMA)
Double WMA (DWMA)
Double RMA (DRMA)
Triple EMA (TEMA)
Triple SMA (TSMA)
Triple WMA (TWMA)
Triple RMA (TRMA)
Symmetrically Weighted Moving Average (SWMA) ** length does not apply **
Arnaud Legoux Moving Average (ALMA)
Variable Index Dynamic Average (VIDYA)
Fractal Adaptive Moving Average (FRAMA)
I wrote this script after identifying some interesting moving average bands with my AMACD indicator and wanting to see them on the price chart. As an example look at the interactions between ETHBUSD 4hr and the band of VIDYA 32 Open and VIDYA 39 Open. Or start from the good old BTC Bull market support band, Weekly EMA 21 and SMA 20 and see if you can get a better fit. I find the Double RMA 22 a better fast option than the standard EMA 21.

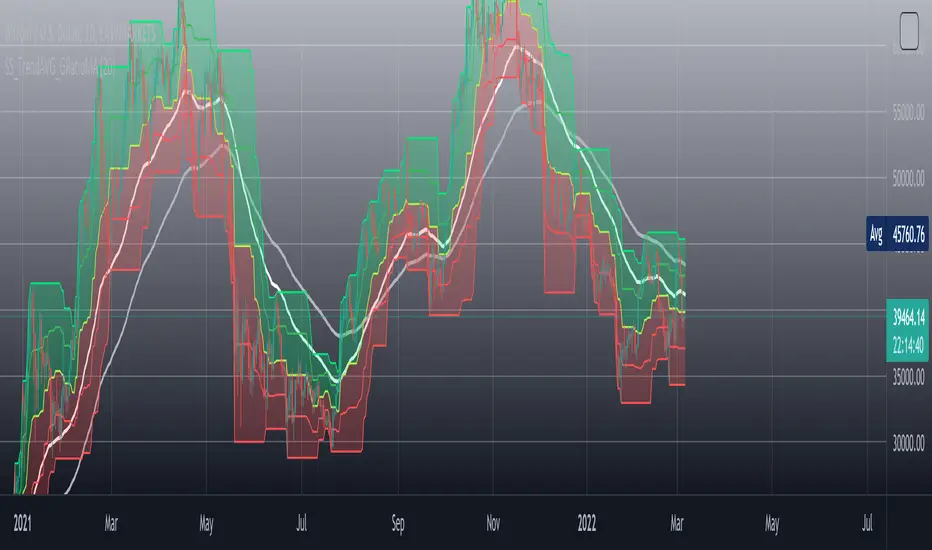
[SS]_TrendAVGZones_and_GoldenRatioMAThe _TrendAVGZones_and_GoldenRatioMA is an indicator that is composed first of a channel made of three price averages ( base average, middle lower and middle upper ) in red is the previous corrections average and in green the previous rises average. So that way we the setting of stop loss targets and price targets can be set up at first glance. It adjusts to any timeframe so no worries 'bout that.
Also I added two exponential moving averages ( white and silver lines ) on the chart which I modified their equations by multiplying as it follows :
is the simple modification I added to fine tune it's precision and after some trials and errors I finally found a perfect spot. Now I tried it with historical data of Bitcoin and when the two Golden Ratio EMA crosses there's a big move coming imminently : if the white one is on top of the silver one the trend is bullish inversely the white one finds itself under the silver line then it needs to cross to expect a reversal.
rphi = 0.6180339887498948 = is the conjugate root of the golden ratio also called the silver ratio
phi = 1.6180339887498948 = golden ratio
It should be used to find short to mid term price targets selling as well as buying ones. If you're a long term trader I suggest using trend lines analysis in combination with it.
I hope to make this indicator a community owned indicator so don't hesitate to perfect it so we can build the best tool traders can hope for ! Together we will no longer ask wen lambo? we will get it!
IF you've got any question you can always DM me
take care of yourselves you future millionaires :D
-SS
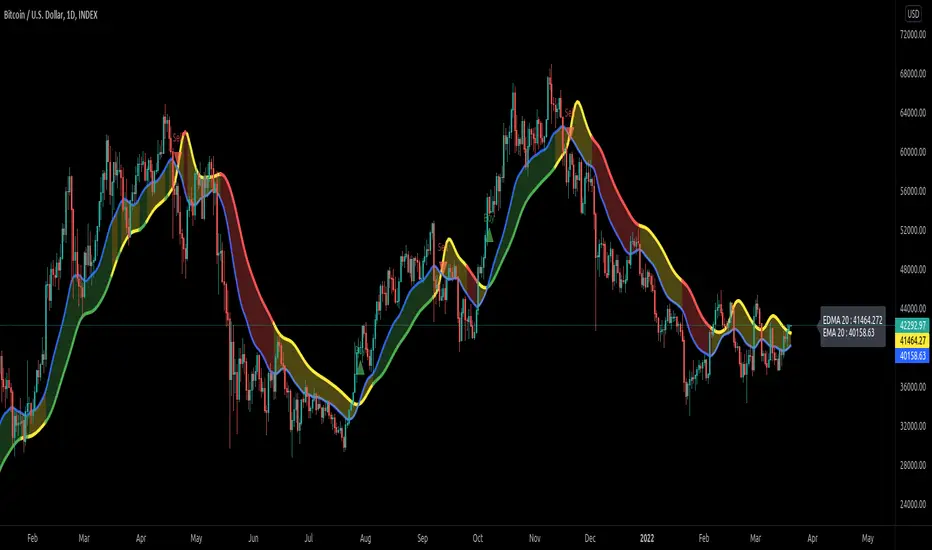
Exponentially Deviating Moving Average (MZ EDMA)Exponentially Deviating Moving Average (MZ EDMA) is derived from Exponential Moving Average to predict better exit in top reversal case.
EDMA Philosophy
EDMA is calculated in following steps:
In first step, Exponentially expanding moving line is calculated with same code as of EMA but with different smoothness (1 instead of 2).
In 2nd step, Exponentially contracting moving line is calculated using 1st calculated line as source input and also using same code as of EMA but with different smoothness (1 instead of 2).
In 3rd step, Hull Moving Average with 3/2 of EDMA length is calculated using final line as source input. This final HMA will be equal to Exponentially Deviating Moving Average.
EDMA Advantages
EDMA's main advantage is that in case of top price reversal it deviates from conventional EMA of 2*Length. This benefits in using EDMA for EMA cross with quick signals avoiding unnecessary crossovers. EDMA's deviation in case of top reversal can be seen as below:
EDMA presents better smoothened curve which acts as better Support and resistance. EDMA coparison with conventional EMA of 2*length of EDMA is as follows.
Additional Features
EMA Band: EMA band is shown on chart to better visualize EMA cross with EDMA.
Dynamic Coloring: Chikou Filter library is used for derivation of dynamic coloring of EDMA and its band.
Alerts: Alerts are provided of all trade signals. Weak buy/sell would trigger if EMA of 2*EDMA_length crosses EDMA. Strong buy/sell would trigger if EMA of same length as of EDMA crosses EDMA.
Trade Confirmation with Chikou Filter: Trend filteration from Chikou filter library is used as an option to enhance trades signals accuracy.
Defaults
Currently default EDMA and EMA1 length is set to 20 period which I've found better for higher timeframes but this can be adjusted according to user's timeframe. I would soon add Multi Timeframe option in script too. Chikou filter's period is set to 25.
MACD Alert [All MA in one] [Smart Crypto Trade (SCT)]This code is a gift from "Smart Crypto Trade (SCT)" group
MACD indicator contains 3 EMA, I think one of the best usage of MACD is trend detection and divergences.
In our indicator, you can select the type of Moving averages that used in macd.
You can using "MACD" based on several types of moving averages including:
Exponential Moving Average ( EMA )
Volume-Weighted Moving Average ( VWMA )
Simple Moving Average ( SMA )
Weighted Moving Average ( WMA )
Exponentially Weighted Moving Average (RMA) that used in RSI
Smoothed Moving Average ( SMMA )
Arnaud Legoux Moving Average ( ALMA )
Double EMA ( DEMA )
Double SMA (DSMA)
Double WMA (DWMA)
Double RMA (DRMA)
Triple EMA ( TEMA )
Triple SMA (TSMA)
Triple WMA (TWMA)
Triple RMA (TRMA)
Linear regression curve Moving Average ( LSMA )
Variable Index Dynamic Average ( VIDYA )
Fractal Adaptive Moving Average ( FRAMA )
In other words we tried to collect all the most popular MAs in our MACD indicator.
In addition, you can use four types of alert or alarm conditions for detection LONG or SHORT positions and trends. For this, you must set an alert in alert tab and set the condition based on four defaults conditions.
Enjoy

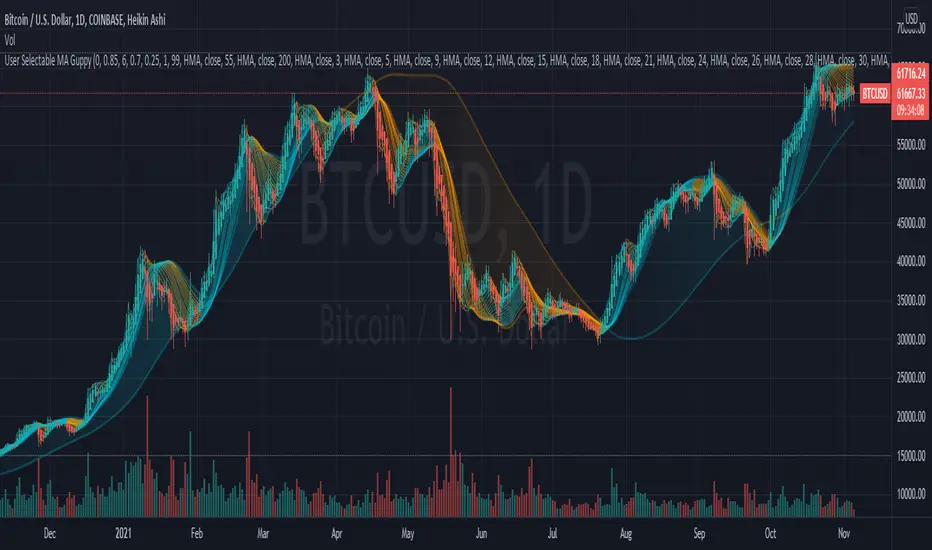
User Selectable Moving Average GuppyA version of the popular "Moving Average Ribbon" or "Guppy" indicators, except nearly everything about it is user selectable. The user can change the source, period, and type of moving average used for every single line on the chart. Note: The visuals are fairly intensive and may take a moment to catch up after adjusting settings.
Credit: This script utilizes the "Color Gradient Framework" tutorial by LucF (PineCoders) to create gradient visuals, which are also customizable for the user.
Moving Average Options:
Running (SMoothed) Moving Average (RMA or SMMA) - Slowest
Simple Moving Average (SMA) - Slow
Exponential Moving Average (EMA) - Responds faster to price than SMA
Weighted Moving Average (WMA)
Volume-Weighted Moving Average (VWMA)
Triple EMA (TEMA)
Exponential Hull Moving Average (EHMA) - Hull with Smoothing (Slower than Hull)
Least Squares Moving Average (LSMA) - Simple Linear Regression
Arnaud Legoux Moving Average (ALMA) - Adjustable, set offset=1 to be current, offset=0.85 for good smoothing (Slower)
Hull Moving Average (HMA) - Normally responds fastest to price of all options
Value Added :
This script is unique in that it allows the user to chart the "Guppy", except nearly everything about it is customizable. The user can change the source, period, and type of moving average used for every single line.
Typically, the Guppy is plotted with simple moving average or exponential moving average, which respond much slower to price than the Hull Moving Average, which this indicator uses as default. (Elimination of lag)
The Hull MA settings for the highest time frame moving averages should work well for assessing the overall macro trend, with a nice visual presentation. Additional labels and alerts for the macro trend are available.
Furthermore, this script provides many more options for type of moving average than is typical for a moving average indicator that provides the user with options, including advanced options such as Hull, TEMA, and ALMA.
The visual presentation is customizable and should provide some entertainment for users who want to create pretty charts.
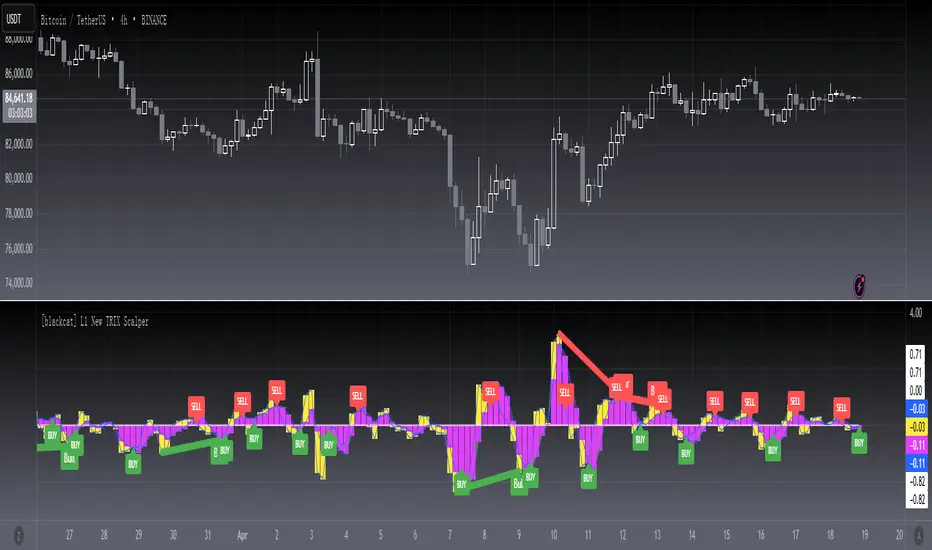
[blackcat] L1 New TRIX ScalperNOTE: Because the originally released script failed to comply with the House Rule in the description, it was banned. After revising and reviewing the description, it is republished again. Please forgive the inconvenience caused.
Level: 1
Background
The Triple Exponential Moving Average (TRIX) indicator is a strong technical analysis tool. It can help investors determine the price momentum and identify oversold and overbought signals in a financial asset. Jack Hutson is the creator of the TRIX indicator . He created it in the early 1980s to show the rate of change in a triple exponentially smoothed moving average.
When used as an oscillator, it shows a potential peak and trough price zones. A positive value tells traders that there is an overbought market while a negative value means an oversold market. When traders use TRIX as a momentum indicator, it filters spikes in the price that are vital to the general dominant trend.
A positive value means momentum is rising while a negative value means that momentum is reducing. A lot of analysts believe that when the TRIX crosses above the zero line it produces a buy signal, and when it closes below the zero line, it produces a sell signal.The indicator has three major components:
Zero line
TRIX line (or histograms)
Percentage Scale
Function
The TRIX indicator determines overbought and oversold markets, and it can also be a momentum indicator. Just as it is with most oscillators, TRIX oscillates around a zero line. Additionally, divergences between price and TRIX can mean great turning points in the market. TRIX calculates a triple exponential moving average of the log of the price input. It calculates this based on the time specified by the length input for the current bar.
Trading TRIX indicator signals
Zero line cross
TRIX can help determine the impulse of the market. With the 0 value acting as a centerline, if it crosses from below, it will be mean that the impulse is growing in the market.Traders can, therefore, look for opportunities to place buy orders in the market. Similarly, a cross of the centerline from above will mean a shrinking impulse in the market. Traders can, therefore, look for opportunities to sell in the market.
Signal line cross
To select the best entry points, investors add a signal line on the TRIX indicator. The signal line is a moving average of the TRIX indicator, and due to this, it will lag behind the TRIX.A signal to place a buy order will occur when the TRIX crosses the signal line from below. In the same way, a signal to place a sell order will come up when the TRIX crosses the signal line from above. This is applicable in both trending and ranging markets.In trending markets, a signal line cross will indicate an end of the price retracement, and the main trend will resume. In ranging markets, a signal line confirms that resistance and support zones have been upheld in the market.
Divergences
Traders can use the Triple Exponential Average can to identify when important turning points can happen in the market. They can achieve this by looking at divergences. Divergences happen when the price is moving in the opposite direction as the TRIX indicator.When price makes higher highs but the TRIX makes lower highs, it means that the up-trend is weakening, and a bearish reversal is about to form. When the price makes lower lows, but the TRIX makes higher lows, it means that a bullish reversal is about to happen. Bullish and bearish divergences happen when the security and the indicator do not confirm themselves. A bullish divergence can happen when the security makes a lower low, but the indicator forms a higher low. This higher low means less downside momentum that may foreshadow a bullish reversal. A bearish divergence happens when the commodity makes a higher low, but the indicator forms a lower high. This lower high indicates weak upside momentum that can foreshadow a bearish reversal sometimes. Bearish divergences do not work well in strong uptrends. Even though momentum appears to be weakening due to the indicator is making lower highs, momentum still has a bullish bias as long as it is above its centerline.When bullish and bearish divergences work, they work very well. The secret is to separate the bad signals from the good signals.
Key Signal
RXval --> new TRIX indicator.
AvgTRX --> linear regression average of new TRIX indicator.
Remarks
This is a Level 1 free and open source indicator.
Feedbacks are appreciated.
CPR, Camarilla & Moving AverageThis script is created primarily for Intraday trading but can also be used for short and long term trading. This is a combination of Central Pivot Range (CPR), Moving Averages and Camarilla Pivot levels (with inner levels). This helps you to combine the strategies of CPR and Moving Averages to identify the best trading opportunities with greater edge. Central Pivot Range and Camarilla pivots are taken from PivotBoss by Franc Ochoa.
Key features:
# Daily CPR levels
# Weekly CPR levels
# Monthly CPR levels
# Previous Day High and Lows
# Previous Week Highs and Lows
# Previous Month Highs and Lows
# Camarilla Pivots with inner Levels
# CPR Levels for the next Day, Week and Month
# 5 Simple moving averages and 5 Exponential Moving Averages
What separates this script from other scripts with CPR and Moving averages?
# One of the few indicators (if not the only one) which combines the 2 types of Moving Averages, CPR and also Camarilla Pivots.
# CPR Levels for not just the next Day, but for next Week(Weekly CPR) and Month(Monthly CPR) also.
# Hide the previous day's levels according to your wish. This is the most unique feature of this indicator. You can set the number of Daily CPR levels you want to load in the chart. This is not just for the Daily CPR but also for the Weekly and Monthly CPR also. This makes the chart less cluttered and prevents the candles from getting buried in the indicators. Please notice how the previous day's CPR levels are hidden in the displayed demo chart on the script page. In the chart, only one trading day's data is shown(by default).
# This script is OPEN SOURCE.
Strategies :
For CPR & Camarilla Strategies for intraday trading and swing trading refer to the book 'Secrets of a Pivot Boss: Revealing Proven Methods for Profiting in the Market' by Franklin O. Ochoa.
Moving averages strategies :
Moving averages can be combined and also used individually for several strategies
* 9 EMA can be used as trailing stop loss for strong moving trends that helps you to catch big moves.
* 20sma can be used not just trailing stop loss but also for taking re-entry to the trend.
* Golden cross - The golden cross occurs when a short-term moving average crosses over a major long-term moving average to the upside. This indicates a bullish turn in the market. Eg: 50 SMA cuts 200 SMA from below.
* Death Cross - The death cross occurs when the short term moving average crosses the long-term average from above. This indicates a bearish turn in the market. Eg: 50 SMA cuts 200 SMA from above.
* When 20 SMA is above 50 SMA and 20 SMA and 50 SMA are angling up like parallel lines, then it denotes bullish strength. If this happens right after Golden Cross, big moves to the upside can be expected.
* When 20 SMA is below 50 SMA and 20 SMA and 50 SMA are angling down like parallel lines, then it denotes bearish strength. If this happens right after Death Cross, big moves to the downside can be expected.
* When 20SMA and 50 SMA are going flat and crossing each other, then it denotes sideways sentiment.
Moving average strategies are taken from the book 'How to Make Money in Intraday Trading' by Ashwani Gujral. For learning more about how to combine CPR and Moving averages in your trading please refer to this book.

Pinescript v4 - The Holy Grail (Trailing Stop)After studying several other scripts, I believe I have found the Holy Grail! (Or perhaps I've just found a bug with Tradingview's Pinescript v4 language) Anyhow, I'm publishing this script in the hope that someone smarter than myself could shed some light on the fact that adding a trailing stop to any strategy seems to make it miraculously...no that's an understatement...incredulously, stupendously, mind-bendingly profitable. I'm talking about INSANE profit factors, higher than 200x, with drawdowns of <10%. Sounds too good to be true? Maybe it is...or you could hook it up to your LIVE broker, and pray it doesn't explode. This is an upgraded version of my original Pin Bar Strategy.
Recommended Chart Settings:
Asset Class: Forex
Time Frame: H1
Long Entry Conditions:
a) Exponential Moving Average Fan up trend
b) Presence of a Bullish Pin Bar
c) Pin Bar pierces the Exponential Moving Average Fan
Short Entry Conditions:
a) Exponential Moving Average down trend
b) Presence of a Bearish Pin Bar
c) Pin Bar pierces the Exponential Moving Average Fan
Exit Conditions:
a) Trailing stop is hit
b) Moving Averages cross-back (optional)
c) It's the weekend
Default Robot Settings:
Equity Risk (%): 3 //how much account balance to risk per trade
Stop Loss (x*ATR, Float): 0.5 //stoploss = x * ATR, you can change x
Stop Loss Trail Points (Pips): 1 //the magic sauce, not sure how this works
Stop Loss Trail Offset (Pips): 1 //the magic sauce, not sure how this works
Slow SMA (Period): 50 //slow moving average period
Medium EMA (Period): 18 //medium exponential moving average period
Fast EMA (Period): 6 //fast exponential moving average period
ATR (Period): 14 // average true range period
Cancel Entry After X Bars (Period): 3 //cancel the order after x bars not triggered, you can change x
Backtest Results (2019 to 2020, H1, Default Settings):
AUDUSD - 1604% profit, 239.6 profit factor, 4.9% drawdown (INSANE)
NZDUSD - 1688.7% profit, 100.3 profit factor, 2.5% drawdown
GBPUSD - 1168.8% profit, 98.7 profit factor, 0% drawdown
USDJPY - 900.7% profit, 93.7 profit factor, 4.9% drawdown
USDCAD - 819% profit, 31.7 profit factor, 8.1% drawdown
EURUSD - 685.6% profit, 26.8 profit factor, 5.9% drawdown
USDCHF - 1008% profit, 18.7 profit factor, 8.6% drawdown
GBPJPY - 1173.4% profit, 16.1 profit factor, 7.9% drawdown
EURAUD - 613.3% profit, 14.4 profit factor, 9.8% drawdown
AUDJPY - 1619% profit, 11.26 profit factor, 9.1% drawdown
EURJPY - 897.2% profit, 6 profit factor, 13.8% drawdown
EURGBP - 608.9% profit, 5.3 profit factor, 9.8% drawdown (NOT TOO SHABBY)
As you can clearly see above, this forex robot is projected by the Tradingview backtester to be INSANELY profitable for all common forex pairs. So what was the difference between this strategy and my previous strategies? Check my code and look for "trail_points" and "trail_offset"; you can even look them up in the PineScript v4 documentation. They specify a trailing stop as the exit condition, which automatically closes the trade if price reverses against you.
I however suspect that the backtester is not properly calculating intra-bar price movement, and is using a simplified model. With this simplfied approach, the trailing stop code becomes some sort of "holy grail" generator, making every trade entered profitable.
Risk Warning:
This is a forex trading strategy that involves high risk of equity loss, and backtest performance will not equal future results. You agree to use this script at your own risk.
Hint:
To get more realistic results, and *maybe* overcome the intrabar simulation error, change the settings to: "Stop Loss Trail Points (pips)": 100
I am not sure if this eradicates the bug, but the entries and exits look more proper, and the profit factors are more believable.

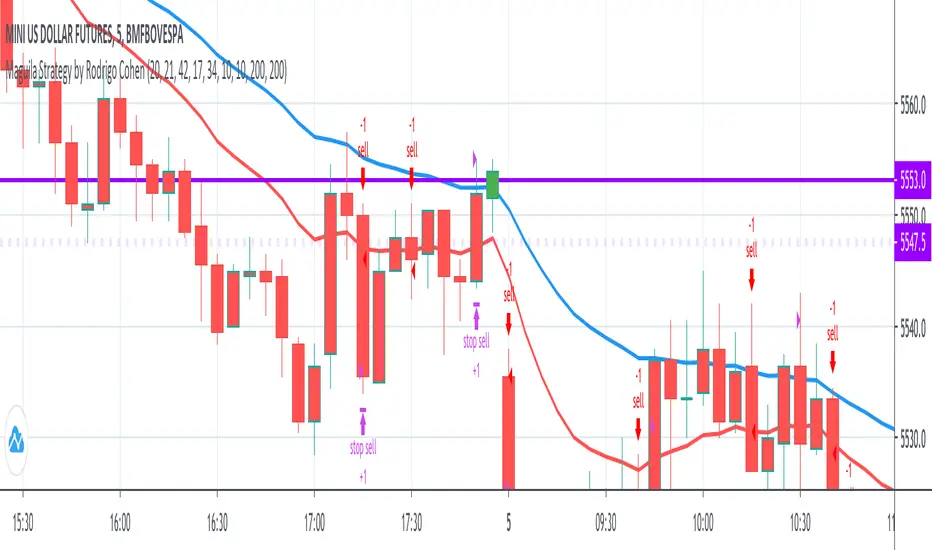
Maguila Strategy by Rodrigo CohenREAD BEFORE USE!!!
!!!ALERT!!!! THIS CODE ONLY WORKS WITH WDO AND WIN , BOTH WITH TIMEFRAMES 1 MINUTE AND 5 MINUTE.
This is a test to the Maguila strategy created by Rodrigo Cohen.
This code MUST be validaded by Rodrigo Cohen, use ONLY for tests.
Some results are different from Cohen's videos, so the McGuinley indicator needs some ajustments.
FUTURES: WIN , WDO
TIME FRAME: 1 Minute (also works in 5 minutes)
INDICATORS: McGinley Dynamic accompanied by the Exponential Moving Average coloring rule of 21 and 42 periods
MARKET TYPE: In trend (up or down)
INPUT:
1. When buying (long) = Market in an upward trend, the average of 21 crosses that of 42 upwards. When the price returns to the average of 21, wait for a positive candle in the Maguila's color and buy a break from the maximum of this signal candle.
2. On sale (short) = Downtrend market, the average of 21 crosses that of 42 downwards. When the price returns to the average of 21, wait for a negative candle in the Maguila's color and sell when the minimum of this signal candle breaks.
GAIN and LOSS are technical.
DEFAULT VALUES:
Averages:
- 1 minute - EMA 21 and EMA 42
- 5 minute - EMA 17 and EMA 34
Gains and Loss:
- WDO - 10 points
- WIN - 200 points
Noro's CrossMASimple strategy. Price and moving average crossing. There is a choice of type of moving average.
Moving average types
SMA = Simple Moving Average
EMA = Exponential Moving Average
VWMA = Volume-Weighted Moving Average
DEMA = Double Exponential Moving Average
TEMA = Triple Exponential Moving Average
KAMA = Kaufman's Adaptive Moving Average
PCMA = Central line of price channel (Donchian channel)

Noro's MAs Tests v1.1Trade strategy from one moving average. To choose what sliding average it is more effective to use for this pair and this timeframe.
Types:
1 = SMA = Simple Moving Average
2 = EMA = Exponential Moving Average
3 = VWMA = Volume-Weighted Moving Average
4 = DEMA = Double Exponential Moving Average
5 = TEMA = Triple Exponential Moving Average
6 = KAMA = Kaufman's Adaptive Moving Average
7 = Price Channel
In new version 1.1:
+ "antipila"
+ longs
+ shorts

Noro's MAs TestsTrade strategy from one moving average. To choose what sliding average it is more effective to use for this pair and this timeframe.
Types:
1 = SMA = Simple Moving Average
2 = EMA = Exponential Moving Average
3 = VWMA = Volume-Weighted Moving Average
4 = DEMA = Double Exponential Moving Average
5 = TEMA = Triple Exponential Moving Average
6 = KAMA = Kaufman's Adaptive Moving Average
7 = Price Channel

Moving Average RibbonThis is an extension of the Madrid Moving Average Ribbon public script to allow for different kinds of moving averages (the original allows only exponential and simple). Possible entries in the MA Type argument field are:
sma (simple moving average)
ema (exponential moving average)
wma (weighted moving average)
trima (triangular moving average)
zlema (zero-lag exponential moving average)
dema (double exponential moving average)
tema (triple exponential moving average)
hma (hull moving average)
If the argument given by the user does not match anything from the above list, it will default to ema.
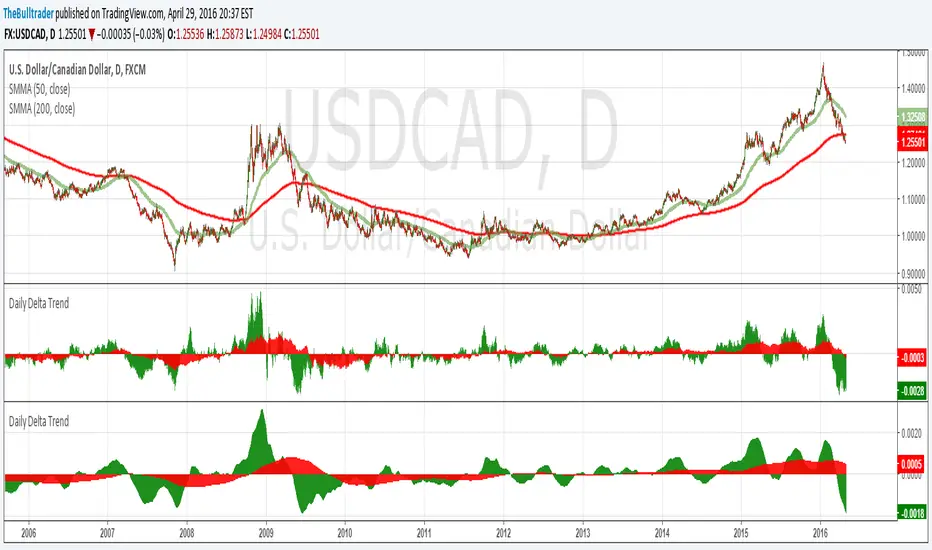
Daily Delta TrendDaily Delta Trend is a useful exponential moving average of the 50 day and 200 day simple moving average. In the first Daily Delta Trend I realized that the simple moving averages were pretty choppy as they were buy then sell over short period of times. So I thought taking an average of another average would smooth my results and give it buy and sell signals more clearly. In chart 1, you can see that it is choppy, and in chart 2 is much smoother.
The way I've been interpreting the chart is to trade it only when the 50-day average (GREEN) Trades with 200-day average (RED). For example, when red and green are both >0 = Buy and both <0 = Sell.
Just from a little of pretesting, I was able to find solid trades from multiple pairs.
DISCLAIMER, I have not actually traded this indicator as I just wrote it for the past few hours, But I thought it was interesting and maybe I might trade it. Feel free to play with it and comment back :P
Market Health Indicator# Market Health Indicator - Documentation
## Overview
The Market Health Indicator is a Pine Script technical analysis tool designed for TradingView that evaluates overall market conditions by analyzing the relationship between price and three Exponential Moving Averages (EMAs), as well as the relationships between the EMAs themselves. The indicator provides a quantitative score and actionable investment recommendations.
---
## Purpose
This indicator helps traders and investors:
- Assess the overall health and trend strength of a market or security
- Make informed decisions about position sizing
- Identify bullish, bearish, or neutral market conditions
- Determine when to increase, reduce, or exit positions
---
## Scoring Methodology
### Scoring System
The indicator evaluates **6 conditions**, each contributing either **+1** or **-1** to the total score:
#### Price vs EMA Conditions (3 conditions)
1. **Price vs EMA 21**
- Price > EMA 21 → +1
- Price < EMA 21 → -1
2. **Price vs EMA 50**
- Price > EMA 50 → +1
- Price < EMA 50 → -1
3. **Price vs EMA 100**
- Price > EMA 100 → +1
- Price < EMA 100 → -1
#### EMA Relationship Conditions (3 conditions)
4. **EMA 21 vs EMA 100**
- EMA 21 > EMA 100 → +1
- EMA 21 < EMA 100 → -1
5. **EMA 21 vs EMA 50**
- EMA 21 > EMA 50 → +1
- EMA 21 < EMA 50 → -1
6. **EMA 50 vs EMA 100**
- EMA 50 > EMA 100 → +1
- EMA 50 < EMA 100 → -1
### Total Score Range
- **Minimum Score**: -6 (all conditions bearish)
- **Maximum Score**: +6 (all conditions bullish)
---
## Market Health Status
Based on the total score, the indicator assigns one of five market health statuses:
| Score Range | Status | Interpretation |
|-------------|--------|----------------|
| 4 to 6 | **Strong Bullish** | All or most conditions favor upward momentum |
| 2 to 3 | **Bullish** | Majority of conditions are positive |
| -1 to 1 | **Neutral** | Mixed signals, no clear directional bias |
| -3 to -2 | **Bearish** | Majority of conditions are negative |
| -6 to -4 | **Strong Bearish** | All or most conditions favor downward momentum |
---
## Investment Level Recommendations
The indicator provides position sizing recommendations based on the score:
| Score Range | Investment Level | Action |
|-------------|-----------------|--------|
| 4 to 6 | **100% Invested** | Maximum exposure - strong bullish conditions |
| 2 to 3 | **75% Invested** | High exposure - moderately bullish conditions |
| 0 to 1 | **50% Invested** | Moderate exposure - neutral to slightly positive conditions |
| Below 0 | **Exit Weak Stocks** | Reduce exposure - bearish conditions, exit underperforming positions |
---
## Installation & Setup
### Installation Steps
1. Open TradingView and navigate to any chart
2. Click on **Pine Editor** at the bottom of the screen
3. Copy the entire Pine Script code
4. Paste it into the Pine Editor
5. Click **"Add to Chart"**
### Configuration Options
The indicator includes two customizable settings accessible via the settings gear icon:
#### 1. Table Position
Choose where the indicator table appears on your chart:
- **Top**: top_left, top_center, top_right
- **Middle**: middle_left, middle_center, middle_right
- **Bottom**: bottom_left, bottom_center, bottom_right
**Default**: top_right
#### 2. Table Size
Adjust the text size of the indicator table:
- **tiny**: Smallest text size
- **small**: Small text size
- **normal**: Standard text size (default)
- **large**: Large text size
- **huge**: Largest text size
**Default**: normal
---
## Understanding the Display
### Table Components
The indicator displays a table with the following rows:
1. **Header Row (Colored)**
- Left cell: Market Health status
- Right cell: Current score out of 6
- Color indicates market condition (green = bullish, yellow = neutral, red = bearish)
2. **Investment Level Row (Blue)**
- Shows recommended position sizing based on current score
- Helps with portfolio management decisions
3. **Column Headers (Gray)**
- "Condition" - describes each evaluation criteria
- "Score" - shows the +1 or -1 value
4. **Condition Rows (6 rows)**
- Each row shows one of the 6 scoring conditions
- Left column: condition description
- Right column: score value (+1 in green or -1 in red)
---
## Interpretation Guidelines
### Strong Bullish (Score 4-6)
**Characteristics:**
- Price trading above all major EMAs
- EMAs aligned in bullish order (21 > 50 > 100)
- Strong upward momentum
**Action:**
- Maintain full exposure (100% invested)
- Consider adding to winning positions
- Look for pullbacks as buying opportunities
### Bullish (Score 2-3)
**Characteristics:**
- Price above most EMAs
- Generally positive EMA alignment
- Moderate upward trend
**Action:**
- Maintain high exposure (75% invested)
- Hold existing positions
- Be selective with new entries
### Neutral (Score -1 to 1)
**Characteristics:**
- Mixed signals from price and EMAs
- No clear trend direction
- Market indecision
**Action:**
- Reduce exposure to 50%
- Wait for clearer signals
- Focus on risk management
- Consider range-bound strategies
### Bearish (Score -2 to -3)
**Characteristics:**
- Price below most EMAs
- Generally negative EMA alignment
- Moderate downward trend
**Action:**
- Exit weak positions
- Reduce overall exposure
- Raise cash levels
- Protect capital
### Strong Bearish (Score -4 to -6)
**Characteristics:**
- Price trading below all major EMAs
- EMAs aligned in bearish order (21 < 50 < 100)
- Strong downward momentum
**Action:**
- Exit weak stocks immediately
- Minimal to no long exposure
- Preserve capital
- Wait for market conditions to improve
---
## Best Practices
### Usage Tips
1. **Timeframe Selection**
- Works on all timeframes
- Higher timeframes (daily, weekly) provide more reliable signals
- Lower timeframes (intraday) may generate more frequent signals but with higher noise
2. **Combine with Other Analysis**
- Use as a component of a comprehensive trading strategy
- Complement with support/resistance levels
- Consider volume and other momentum indicators
- Factor in fundamental analysis for longer-term positions
3. **Position Sizing**
- Treat investment level recommendations as guidelines, not rigid rules
- Adjust based on your risk tolerance and account size
- Consider your overall portfolio allocation
4. **Risk Management**
- Always use stop losses regardless of indicator reading
- Don't ignore risk management during "Strong Bullish" periods
- The indicator shows trend, not specific entry/exit points
### Limitations
- **Lagging Nature**: EMAs are lagging indicators, so signals may come after trend changes have begun
- **Whipsaw Risk**: In choppy, sideways markets, the indicator may generate mixed signals
- **Not a Standalone System**: Should be used as part of a broader trading strategy
- **No Predictive Power**: Shows current conditions, not future direction
- **Market Context**: May need adjustment during extreme market conditions or unusual volatility
---
## Technical Details
### EMA Calculations
The indicator uses three standard Exponential Moving Averages:
- **EMA 21**: Short-term trend (approximately 1 month of trading days)
- **EMA 50**: Medium-term trend (approximately 2.5 months)
- **EMA 100**: Long-term trend (approximately 5 months)
EMAs give more weight to recent prices compared to Simple Moving Averages (SMAs), making them more responsive to price changes.
### Update Frequency
- The indicator recalculates on every bar close
- Real-time updates during the current bar formation
- Table displays the most recent completed bar data
### Performance
- Lightweight indicator with minimal computational overhead
- Suitable for use with multiple charts simultaneously
- No historical data storage required beyond standard EMA calculations
---
## Frequently Asked Questions
**Q: Can I change the EMA periods (21, 50, 100)?**
A: The current version uses fixed EMA periods. Modifying these would require editing the Pine Script code directly.
**Q: Does this indicator work on all assets?**
A: Yes, it works on stocks, forex, cryptocurrencies, commodities, and indices - any asset with price data.
**Q: Can I use this for day trading?**
A: Yes, but it's designed for swing trading and position trading. For day trading, consider using lower timeframes and being aware of increased signal noise.
**Q: What if the score keeps changing?**
A: Frequent score changes indicate a choppy or transitional market. Consider waiting for a more stable reading before taking action.
**Q: Should I exit ALL positions when score is negative?**
A: The recommendation is to "Exit Weak Stocks" - focus on underperforming positions. Strong stocks may still be held with appropriate stop losses.
**Q: Can I get alerts based on score changes?**
A: The current version doesn't include alerts, but this functionality could be added with Pine Script modifications.
---
## Version History
**Version 1.0**
- Initial release
- 6-condition scoring system
- Investment level recommendations
- Customizable table position and size
- Overlay on main chart
---
## Support & Feedback
For questions, suggestions, or issues with the indicator:
- Review this documentation thoroughly
- Test the indicator on historical data before live trading
- Adjust settings to match your chart layout preferences
- Always paper trade new strategies before risking real capital
---
## Disclaimer
This indicator is provided for educational and informational purposes only. It does not constitute financial advice, investment advice, trading advice, or any other type of advice. Trading and investing involve substantial risk of loss. Past performance is not indicative of future results. Always do your own research and consult with a qualified financial advisor before making investment decisions.

Moving Average ExponentialThe EMA 50 Trend Filter At the heart of the Sniper system lies the 50-period Exponential Moving Average. Unlike simple moving averages, the EMA applies a weighting factor to recent price data, significantly reducing lag. Role in Strategy:
Trend Identification: Serves as the binary divider between Long and Short bias.
Dynamic Structure: Acts as dynamic support in uptrends and resistance in downtrends.
Signal Filtering: The algorithm automatically suppresses any 'Buy' signals below the line and 'Sell' signals above it, ensuring you never trade against the institutional momentum.

Kalman Ema Crosses - [JTCAPITAL]Kalman EMA Crosses - is a modified way to use Kalman Filters applied on Exponential Moving Averages (EMA Crosses) for Trend-Following.
Credits for the kalman function itself goes to @BackQuant
The Kalman filter is a recursive smoothing algorithm that reduces noise from raw price or indicator data, and in this script it is applied both directly to price and on top of EMA calculations. The goal is to create cleaner, more reliable crossover signals between two EMAs that are less prone to false triggers caused by volatility or market noise.
The indicator works by calculating in the following steps:
Source Selection
The script starts by selecting the price input (default is Close, but can be adjusted). This chosen source is the foundation for all further smoothing and EMA calculations.
Kalman Filtering on Price
Depending on user settings, the selected source is passed through one of two independent Kalman filters. The filter takes into account process noise (representing expected market randomness) and measurement noise (representing uncertainty in the price data). The Kalman filter outputs a smoothed version of price that minimizes noise and preserves underlying trend structure.
EMA Calculation
Two exponential moving averages (EMA 1 and EMA 2) are then computed on the Kalman-smoothed price. The lengths of these EMAs are fully customizable (default 15 and 25).
Kalman Filtering on EMA Values
Instead of directly using raw EMA curves, the script applies a second layer of Kalman filtering to the EMA values themselves. This step significantly reduces whipsaw behavior, creating smoother crossovers that emphasize real momentum shifts rather than temporary volatility spikes.
Trend Detection via EMA Crossovers
-A bullish trend is detected when EMA 1 (fast) crosses above EMA 2 (slow).
-A bearish trend is detected when EMA 1 crosses below EMA 2.
The detected trend state is stored and used to dynamically color the plots.
Visual Representation
Both EMAs are plotted on the chart. Their colors shift to blue during bullish phases and purple during bearish phases. The area between the two EMAs is filled with a shaded region to clearly highlight trending conditions.
Buy and Sell Conditions:
-Buy Condition: When the Kalman-smoothed EMA 1 crosses above the Kalman-smoothed EMA 2, a bullish crossover is confirmed.
-Sell Condition: When EMA 1 crosses below EMA 2, a bearish crossover is confirmed.
Users may enhance the robustness of these signals by adjusting process noise, measurement noise, or EMA lengths. Lower measurement noise values make the filter react faster (but potentially noisier), while higher values make it smoother (but slower).
Features and Parameters:
-Source: Selectable price input (Close, Open, High, Low, etc.).
-EMA 1 Length: Defines the fast EMA period.
-EMA 2 Length: Defines the slow EMA period.
-Process Noise: Controls how much randomness the Kalman filter assumes in price dynamics.
-Measurement Noise: Controls how much uncertainty is assumed in raw input data.
-Kalman Usage: Option to apply Kalman filtering either before EMA calculation (on price) or after (on EMA values).
Specifications:
Kalman Filter
The Kalman filter is an optimal recursive algorithm that estimates the state of a system from noisy measurements. In trading, it is used to smooth prices or indicator values. By balancing process noise (expected volatility) with measurement noise (data uncertainty), it generates a smoothed signal that reacts adaptively to market conditions.
Exponential Moving Average (EMA)
An EMA is a weighted moving average that emphasizes recent data more heavily than older data. This makes it more responsive than a simple moving average (SMA). EMAs are widely used to identify trends and momentum shifts.
EMA Crossovers
The crossing of a fast EMA above a slow EMA suggests bullish momentum, while the opposite suggests bearish momentum. This is a cornerstone technique in trend-following systems.
Dual Kalman Filtering
Applying Kalman both to raw price and to the EMAs themselves reduces whipsaws further. It creates crossover signals that are not only smoothed but also validated across two levels of noise reduction. This significantly enhances signal reliability compared to traditional EMA crossovers.
Process Noise
Represents the filter’s assumption about how much the underlying market can randomly change between steps. Higher values make the filter adapt faster to sudden changes, while lower values make it more stable.
Measurement Noise
Represents uncertainty in price data. A higher measurement noise value means the filter trusts the model more than the observed data, leading to smoother results. A lower value makes the filter more reactive to observed price fluctuations.
Trend Coloring & Fill
The use of dynamic colors and filled regions provides immediate visual recognition of trend states, helping traders act faster and with greater clarity.
Enjoy!

AbdullahThis script is a **3-in-1 Combined Indicator** for Pine Script v6, merging three popular technical analysis tools into a single chart overlay. It's designed to provide a comprehensive view of trend direction, momentum, and volatility-based stops.
Here's a breakdown of the three components:
## 1. ZLSMA - Zero Lag LSMA (Zero Lag Least Squares Moving Average)
The ZLSMA is a fast-reacting moving average that aims to eliminate the lag typically associated with standard moving averages. It does this by calculating the difference between a standard **Least Squares Moving Average (LSMA)** and a smoothed version of that LSMA, then adding that difference back to the original LSMA.
* **Customizable Inputs:** Length, Offset, and Source Price.
* **Plot:** A thick yellow line indicating the zero-lag trend.
---
## 2. Chandelier Exit
The Chandelier Exit is a volatility-based tool that places a trailing stop either above the price (for a long trade exit) or below the price (for a short trade exit). It uses the **Average True Range (ATR)** to set the stop distance.
* **Key Function:** Identifies potential stop-loss levels and trend changes.
* **Customizable Inputs:** ATR Period, ATR Multiplier, and an option to use the Close price for extremum calculations.
* **Visuals:**
* Plots the **Long Stop (Green)** and **Short Stop (Red)** lines, which switch based on the current trend direction.
* Optional **Buy/Sell Labels** and **Highlighting** (shaded background) to clearly mark the current trend state (long or short).
---
## 3. Exponential Moving Average (EMA) with Optional Smoothing Bands
This section plots a standard **Exponential Moving Average (EMA)** and includes a unique feature to smooth the EMA's output using another moving average or Bollinger Bands.
* **EMA Plot:** A blue line representing the EMA, with customizable Length, Source, and Offset.
* **Optional Smoothing:** The EMA line itself can be smoothed by applying a secondary moving average (SMA, EMA, WMA, etc.) to the EMA's values.
* **Bollinger Bands Option:** If **SMA + Bollinger Bands** is selected for smoothing, it plots **Upper** and **Lower Bands** based on the standard deviation of the EMA, providing a visual envelope for volatility around the smoothed line.
LA - MACD EMA BandsOverview of the "LA - MACD EMA Bands" Indicator
For Better view, use this indicator along with "LA - EMA Bands with MTF Dashboard"
The "LA - MACD EMA Bands" is a custom technical indicator written in Pine Script v6 for TradingView. It builds on the traditional Moving Average Convergence Divergence (MACD) oscillator by incorporating additional smoothing via Exponential Moving Averages (EMAs) and Bollinger Bands (BB) applied directly to the MACD line. This creates a multi-layered momentum and volatility tool displayed in a separate pane below the price chart (not overlaid on the price itself).
The indicator allows for customization, such as selecting a different timeframe (for multi-timeframe analysis) and adjusting period lengths. It fetches data from the specified timeframe using request.security with lookahead enabled to avoid repainting issues. The core idea is to provide insights into momentum trends, crossovers, and volatility expansions/contractions in the MACD's behavior, making it suitable for identifying potential trend reversals, continuations, or ranging markets.
Unlike a standard MACD, which focuses primarily on momentum via a single line, signal line, and histogram, this version emphasizes longer-term smoothing and volatility boundaries. It uses visual fills between lines to highlight bullish/bearish conditions, aiding quick interpretation. Below, I'll break down each component, its calculation, visual representation, and practical uses.
Detailed Breakdown of Each Component and Its Uses
MACD Line (Blue Line, Labeled 'MACD Line')
Calculation: This is the core MACD value, computed as the difference between a fast EMA (default length 12) and a slow EMA (default length 144) of the input source (default: close price). The EMAs are calculated on data from the selected timeframe.
Visuals: Plotted as a solid blue line.
Uses:
Measures momentum: When above zero, it indicates bullish momentum (prices rising faster in the short term); below zero, bearish momentum.
Trend identification: Rising MACD suggests strengthening uptrends; falling suggests downtrends.
Divergence spotting: Compare with price action—e.g., if price makes higher highs but MACD makes lower highs, it signals potential bearish reversal (and vice versa for bullish divergence).
In trading: Often used for entry/exit signals when crossing the zero line or other lines in the indicator.
MACD EMA (Red Line, Labeled 'MACD EMA')
Calculation: A 12-period EMA applied to the MACD Line itself.
Visuals: Plotted as a solid red line.
Uses:
Acts as a signal line for the MACD, smoothing out short-term noise.
Crossover signals: When the MACD Line crosses above the MACD EMA, it can signal a bullish buy opportunity; crossing below suggests a bearish sell.
Trend confirmation: Helps filter false signals in choppy markets by requiring confirmation from this slower-moving average.
In trading: Useful for momentum-based strategies, like entering trades on crossovers in alignment with the overall trend.
Fill Between MACD Line and MACD EMA (Green/Red Shaded Area, Titled 'MACD Fill')
Calculation: The area between the MACD Line and MACD EMA is filled with color based on their relative positions.
Color Logic: Green (with 57% transparency) if MACD Line > MACD EMA (bullish); red if MACD Line < MACD EMA (bearish).
Visuals: Semi-transparent fill for easy visibility without overwhelming the lines.
Uses:
Quick visual cue for momentum shifts: Green areas highlight bullish phases; red for bearish.
Enhances readability: Makes crossovers more apparent at a glance, especially in fast-moving markets.
In trading: Can be used to time entries/exits or as a filter (e.g., only take long trades in green zones).
Bollinger Bands on MACD (BB Upper: Black Dotted, BB Basis: Maroon Dotted, BB Lower: Black Dotted)
Calculation: Bollinger Bands applied to the MACD Line.
BB Basis: 144-period EMA of the MACD Line.
BB Standard Deviation: 144-period stdev of the MACD Line.
BB Upper: BB Basis + (2.0 * BB Stdev)
BB Lower: BB Basis - (2.0 * BB Stdev)
Visuals: Upper and lower bands as black dotted lines; basis as maroon dotted
Uses:
Volatility measurement: Bands expand during high momentum volatility (strong trends) and contract during low volatility (ranging or consolidation).
Mean reversion: When MACD Line touches or exceeds the upper band, it may signal overbought conditions (potential sell); lower band for oversold (potential buy).
Squeeze detection: Narrow bands (squeeze) often precede big moves—watch for breakouts.
In trading: Combines momentum with volatility; e.g., a MACD Line breakout above the upper band could confirm a strong uptrend.
BB Basis EMA (Green Line, Labeled 'BB Basis EMA')
Calculation: A 72-period EMA applied to the BB Basis (which is already a 144-period EMA of the MACD Line).
Visuals: Solid green line.
Uses:
Further smoothing: Provides a longer-term view of the MACD's average behavior, reducing noise from the BB Basis.
Trend direction: Acts as a baseline for the BB system—above it suggests bullish bias in momentum volatility; below, bearish.
Crossover with BB Basis: Can signal shifts in volatility trends (e.g., BB Basis crossing above BB Basis EMA indicates increasing bullish volatility).
In trading: Useful for confirming longer-term trends or as a filter for BB-based signals.
Fill Between BB Basis and BB Basis EMA (Gray Shaded Area, Titled 'BB Basis Fill')
Calculation: The area between BB Basis and BB Basis EMA is filled.
Color Logic: Currently set to a constant semi-transparent gray regardless of position.
Visuals: Semi-transparent gray fill.
Uses:
Highlights divergence: Shows when the shorter-term BB Basis deviates from its longer-term EMA, indicating potential volatility shifts.
Visual aid for crossovers: Makes it easier to spot when BB Basis crosses its EMA.
In trading: Could be used to identify overextensions in volatility (e.g., wide gray areas might signal impending mean reversion).
Zero Line (Black Horizontal Line)
Calculation: A simple horizontal line at y=0.
Visuals: Solid black line.
Uses:
Reference point: Divides bullish (above) from bearish (below) territory for all MACD-related lines.
In trading: Crossovers of the zero line by the MACD Line or BB Basis can signal major trend changes.
How It Differs from a Normal MACD
A standard MACD (e.g., the built-in TradingView MACD with defaults 12/26/9) consists of:
MACD Line: EMA(12) - EMA(26).
Signal Line: EMA(MACD Line, 9).
Histogram: MACD Line - Signal Line (bars showing convergence/divergence).
Key differences in "LA - MACD EMA Bands":
Periods: Uses a much longer slow EMA (144 vs. 26), making it more sensitive to long-term trends but less reactive to short-term price action. The MACD EMA is 12 periods (vs. 9), further emphasizing smoothing.
No Histogram: Replaces the histogram with fills and bands for visual emphasis on crossovers and volatility.
Added Bollinger Bands: Applies BB directly to the MACD Line (with a long 144-period basis), introducing volatility analysis absent in standard MACD. This helps detect "squeezes" or expansions in momentum.
Additional EMA Layer: The BB Basis EMA (72-period) adds a secondary smoothing level to the BB system, providing a hierarchical view of momentum (short-term MACD → mid-term BB → long-term EMA).
Multi-Timeframe Support: Built-in option for higher timeframes, unlike basic MACD.
Focus: Standard MACD is purely momentum-focused; this version integrates volatility (via BB) and multi-layer smoothing, making it better for trend-following in volatile markets but potentially overwhelming for beginners.
Overall, this indicator transforms the MACD from a simple oscillator into a comprehensive momentum-volatility hybrid, reducing false signals in trending markets but introducing lag.
Overall Pros and Cons
Pros:
Enhanced Visualization: Fills and bands make trends, crossovers, and volatility easier to spot without needing multiple indicators.
Reduced Noise: Longer periods (144, 72) smooth out whipsaws, ideal for swing or position trading in trending assets like stocks or forex.
Volatility Integration: BB adds a dimension not in standard MACD, helping identify breakouts or consolidations.
Customizable: Inputs for timeframes and lengths allow adaptation to different assets/timeframes.
Multi-Layered Insights: Combines short-term signals (MACD crossovers) with long-term confirmation (BB EMA), improving signal reliability.
Cons:
Lagging Nature: Long periods (e.g., 144) delay signals, missing early entries in fast markets or leading to late exits.
Complexity: Multiple lines and fills can clutter the pane, requiring experience to interpret; beginners might misread it.
Potential Overfitting: Custom periods (12/144/12/144/72) may work well on historical data but underperform in live trading without backtesting.
No Built-in Alerts/Signals: Relies on visual interpretation; users must manually set alerts for crossovers.
Resource Intensive: On lower timeframes or with lookahead, it might slow chart loading on Trading View.
This indicator shines in strategies combining momentum and volatility, like trend-following with BB squeezes, but test it on your assets (e.g., via backtesting) to ensure it fits your style.
For Better view, use this indicator along with "LA - EMA Bands with MTF Dashboard"

Market Matrix ViewThis technical indicator is designed to provide traders with a quick and integrated view of market dynamics by combining several popular indicators into a single tool. It's not a magic bullet, but a practical aid for analyzing buying/selling pressure, trends, volume, and divergences, saving you time in the decision-making process. Built for flexibility, the indicator adapts to various trading styles (scalping, swing, or long-term) and offers customizable settings to suit your needs.
🟡 Multi-Timeframe Trends
➤ This section displays the trend direction (bullish, bearish, or neutral) across 15-minute, 1-hour, 4-hour, and Daily timeframes, providing multi-timeframe market context. Timeframes lower than the one currently selected will show "N/A."
➤It utilizes fast and slow Exponential Moving Averages (EMAs) for each timeframe:
15m: Fast EMA 42, Slow EMA 170
1h: Fast EMA 40, Slow EMA 100
4h: Fast EMA 36, Slow EMA 107
Daily: Fast EMA 20, Slow EMA 60
🟡 Smart Flow & RVOL
➤ This section displays "Buying Pressure" or "Selling Pressure" signals based on indicator confluence, alongside volume activity ("High Activity," "Normal Activity," or "Low Activity").
➤ Smart Flow combines Chaikin Money Flow (CMF) and Money Flow Index (MFI) to detect buying/selling pressure. CMF measures money flow based on price position within the high-low range, while MFI analyzes money flow considering typical price and volume. A signal is generated only when both indicators simultaneously increase/decrease beyond an adjustable threshold ("Buy/Sell Sensitivity") and volume exceeds a Simple Moving Average (SMA) scaled by the "Volume Multiplier."
➤ RVOL (Relative Volume) calculates relative volume separately for bullish and bearish candles, comparing recent volume (fast SMA) with a reference volume (slow SMA). Thresholds are adjusted based on the selected mode.
🟡 ADX & RSI
This section displays trend strength ("Strong," "Moderate," or "Weak"), its direction ("Bullish" or "Bearish"), and the RSI momentum status ("Overbought," "Oversold," "Buy/Sell Momentum," or "Neutral").
➤ ADX (Average Directional Index) measures trend strength (above 40 = "Strong," 20–40 = "Moderate," below 20 = "Weak"). Direction is determined by comparing +DI (upward movement) with -DI (downward movement). Additionally, an arrow indicates whether the trend's strength is decreasing or increasing.
➤RSI (Relative Strength Index) evaluates price momentum. Extreme levels (above 80/85 = "Overbought," below 15/20 = "Oversold") and intermediate zones (47–53 = "Neutral," above 53 = "Buy Momentum," below 47 = "Sell Momentum") are adjusted based on the selected mode.
🟡 When these signals are active for a potential trade setup, the table's background lights up green or red, respectively.
🟡 Volume Spikes
➤This feature highlights bars with significantly higher volume than the recent average, coloring them yellow on the chart to draw attention to intense market activity.
➤It uses the Z-Score method to detect volume anomalies. Current volume is compared to a 10-bar Simple Moving Average (SMA) and the standard deviation of volume over the same period. If the Z-Score exceeds a certain threshold, the bar is marked as a volume spike.
🟡 Divergences (Volume Divergence Detection)
➤ This feature marks divergences between price and technical indicators on the chart, using diamond-shaped labels (green for bullish divergences, red for bearish divergences) to signal potential trend reversals.
➤ It compares price deviations from a Simple Moving Average (SMA) with deviations of three indicators: Chaikin Money Flow (CMF), Money Flow Index (MFI), and On-Balance Volume (OBV). A bullish divergence occurs when price falls below its average, but CMF, MFI, and OBV rise above their averages, indicating hidden accumulation. A bearish divergence occurs when price rises above its average, but CMF, MFI, and OBV fall, suggesting distribution. The length of the moving averages is adjustable (default 13/10/5 bars for Scalping/Balanced/Swing), and detection thresholds are scaled by "Divergence Sensitivity" (default 1.0).
🟡 Adaptive Stop-Loss (ATR)
➤Draws dynamic stop-loss lines (red, dashed) on the chart for buy or sell signals, helping traders manage risk.Uses the Average True Range (ATR) to calculate stop-loss levels, set at low/high ± ATR × multiplier
🟡 Alerts for trend direction changes in the Info Panel:
➤ Triggers notifications when the trend shifts to Bullish (when +DI crosses above -DI) or Bearish (when +DI crosses below -DI), helping you stay informed about key market shifts.
How to use: Set alerts in Trading View for “Trend Changed to Bullish” or “Trend Changed to Bearish” with “Once Per Bar Close” for reliable signals.
🟡 Settings (Inputs)
➤ The indicator offers customizable settings to fit your trading style, but it's already optimized for Scalping (1m–15m), Balanced (16m–3h59m), and Swing (4h–Daily) modes, which automatically adjust based on the selected timeframe. The visible inputs allow you to adjust the following parameters:
Show Info Panel: Enables/disables the information panel (default: enabled).
Show Volume Spikes: Turns on/off coloring for volume spike bars (default: enabled).
Spike Sensitivity: Controls the Z-Score threshold for detecting volume spikes (default: 2.0; lower values increase signal frequency).
Show Divergence: Enables/disables the display of divergence labels (default: enabled).
Divergence Sensitivity: Adjusts the thresholds for divergence detection (default: 1.0; higher values reduce sensitivity).
Divergence Lookback Length: Sets the length of the moving averages used for divergences (default: 5, automatically adjusted to 13/10/5 for Scalping/Balanced/Swing).
RVOL Reference Period: Defines the reference period for relative volume (default: 20, automatically adjusted to 7/15/20).
RSI Length: Sets the RSI length (default: 14, automatically adjusted to 5/10/14).
Buy Sensitivity: Controls the increase threshold for Buying Pressure signals (default: 0.007; higher values reduce frequency).
Sell Sensitivity: Controls the decrease threshold for Selling Pressure signals (default: 0.007; higher values reduce frequency).
Volume Multiplier (B/S Pressure): Adjusts the volume threshold for Smart Flow signals (default: 0.6; higher values require greater volume).
🟡 This indicator is created to simplify market analysis, but I am not a professional in Pine Script or technical indicators. This indicator is not a standalone solution. For optimal results, it must be integrated into a well-defined trading strategy that includes risk management and other confirmations.

BACAP PRICE STRUCTURE 21 EMA TREND21dma-STRUCTURE
Overview
The 21dma-STRUCTURE indicator is a sophisticated overlay indicator that visualizes price action relative to a triple 21-period exponential moving average structure. Originally developed by BalarezoCapital and enhanced by PrimeTrading, this indicator provides clear visual cues for trend direction and momentum through dynamic bar coloring and EMA structure analysis.
Key Features
Triple EMA Structure
- 21 EMA High: Tracks the exponential moving average of high prices
- 21 EMA Close: Tracks the exponential moving average of closing prices
- 21 EMA Low: Tracks the exponential moving average of low prices
- Dynamic Cloud: Gray fill between high and low EMAs for visual structure reference
Smart Bar Coloring System
- Blue Bars: Price closes above all three EMAs (strong bullish momentum)
- Pink Bars: Daily high falls below the lowest EMA (strong bearish signal)
- Gray Bars: Neutral conditions or transitional phases
- Color Memory: Maintains previous color until new condition is met
Dynamic Center Line
- Trend-Following Color: Green when all EMAs are rising, red when all are falling
- Color Persistence: Maintains trend color during sideways movement
- Visual Clarity: Thicker center line for easy trend identification
Customizable Visual Elements
- Adjustable line thickness for all EMA plots
- Customizable colors for bullish and bearish conditions
- Configurable trend colors for uptrend and downtrend phases
- Optional bar color changes with toggle control
How to Use
Trend Identification
- Rising Green Center Line: All EMAs trending upward (bullish structure)
- Falling Red Center Line: All EMAs trending downward (bearish structure)
- Flat Center Line: Maintains last trend color during consolidation
Momentum Analysis
- Blue Bars: Strong bullish momentum with price above entire EMA structure
- Pink Bars: Strong bearish momentum with high below lowest EMA
- Gray Bars: Neutral or transitional momentum phases
Entry and Exit Signals
- Bullish Setup: Look for blue bars during green center line periods
- Bearish Setup: Look for pink bars during red center line periods
- Exit Consideration: Watch for color changes as potential momentum shifts
Structure Trading
- Support/Resistance: Use EMA cloud as dynamic support and resistance zones
- Breakout Confirmation: Bar color changes can confirm structure breakouts
- Trend Continuation: Color persistence suggests ongoing momentum
Settings
Visual Customization
- Change Bar Color: Toggle to enable/disable bar coloring
- Line Size: Adjust thickness of EMA lines (default: 3)
- Bullish Candle Color: Customize blue bar color
- Bearish Candle Color: Customize pink bar color
Trend Colors
- Uptrend Color: Color for rising EMA center line (default: green)
- Downtrend Color: Color for falling EMA center line (default: red)
- Cloud Color: Fill color between high and low EMAs (default: gray)
Advanced Features
Modified Bar Logic
Unlike traditional EMA systems, this indicator uses refined conditions:
- Bullish signals require close above ALL three EMAs
- Bearish signals require high below the LOWEST EMA
- Enhanced precision reduces false signals compared to single EMA systems
Trend Memory System
- Intelligent color persistence during sideways movement
- Reduces noise from minor EMA fluctuations
- Maintains trend context during consolidation periods
Performance Optimization
- Efficient calculation methods for real-time performance
- Clean visual design that doesn't clutter charts
- Compatible with all timeframes and instruments
Best Practices
Multi-Timeframe Analysis
- Use higher timeframes to identify overall trend direction
- Apply on multiple timeframes for confluence
- Combine with weekly/monthly charts for position trading
Risk Management
- Use bar color changes as early warning signals
- Consider position sizing based on EMA structure strength
- Set stops relative to EMA support/resistance levels
Combination Strategies
- Pair with volume indicators for confirmation
- Use alongside RSI or MACD for momentum confirmation
- Combine with key support/resistance levels
Market Context
- More effective in trending markets than choppy conditions
- Consider overall market environment and sector strength
- Adjust expectations during high volatility periods
Technical Specifications
- Based on 21-period exponential moving averages
- Uses Pine Script v6 for optimal performance
- Overlay indicator that works with any chart type
- Maximum 500 lines for clean performance
Ideal Applications
- Swing trading on daily charts
- Position trading on weekly charts
- Intraday momentum trading (adjust timeframe accordingly)
- Trend following strategies
- Structure-based trading approaches
Disclaimer
This indicator is for educational and informational purposes only. It should not be used as the sole basis for trading decisions. Always combine with other forms of analysis, proper risk management, and consider your individual trading plan and risk tolerance.
Compatible with Pine Script v6 | Works on all timeframes | Optimized for trending markets
